1 Introduction
This tutorial shows you how to make a 'Profile' for your input device.
A Profile describes characteristics of a device that are of interest when combining images.
These characteristics vary among different device models, sometimes even among two devices of the same model.
In order to achieve optimum results it is therefore advisable to measure devices individually.
2 Tone Reproduction Curve
TRC is short for 'Tone Reproduction Curve'.
This curve describes the reaction of a device upon different light intensities in the visible color spectrum.
It is used to linearise input image data.
A TRC is not needed if the input image data is already linear, which is e.g. the case for RAW images of digital cameras.
Creating a TRC happens in two steps.
In a first step a series of images is taken to get measuring points.
In a second step the images are read into FDRGui and the TRC is saved as a file.
(Note: the FDRGui download contains an exposure series that is used for creation of the sample TRC below.)
2.1 Creating the measuring images (digital camera)
A white sheet of paper can be used as motive.
Alternatively any other achromatic motive is suited, e.g. a grey wall.
Position the sheet so that it is illuminated as evenly as possible.
Adjust the focal length so that the paper fills the image format.
As a sharp image is disadvantageous you should not focus.
Now create an image series by halfing the exposure time after each image (interval 1 EV).
The first image should be strongly overexposed resp. 'white'.
The last image should be strongly undexposed resp. 'black'.
Important notes:
-
Look out for the lighting conditions during the image taking session.
Constant light intensity during the session is indispensible for a correct measurement result!
-
Do the exposures under daylight.
Intensity of daylight is constant while e.g. incandescent lamps or tungsten lamps are unsuitable.
Their light intensity oscillates with the line voltage although this is not visible to the human eye!
-
Do the exposures at noon.
That's the time, when light intensity changes least.
-
Do the exposures under a cloudless sky or under complete overcast sky or when there is fog and mist.
2.2 Creating the TRC file
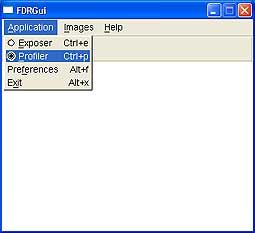
Start FDRGui now and choose 'Profiler' from the 'Application' menu:
| |
 |
| |
Choosing the Profiler from the FDRGui main window |
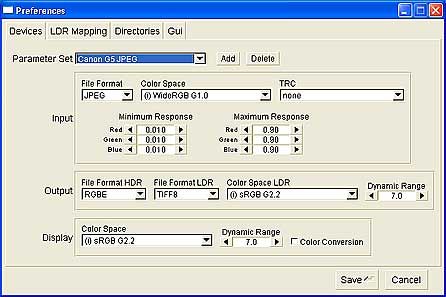
Open the 'Preferences' window by choosing 'Application->Preferences':
| |
 |
| |
Creation of a new Parameter Set |
Add a new Parameter Set with 'Add'.
Within the 'Input' frame choose 'WideRGB G1.0' as color space and 'none' as TRC.
Save the new Parameter Set.
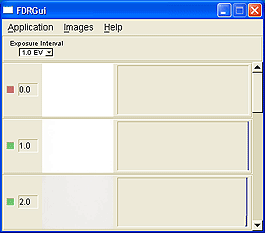
Now choose menu item 'Images->Add' in order to load the exposure series images (the example images are located in directory 'profiles/Canon G5').
The Profiler assigns an exposure value to each image while reading.
The lighest image gets value 0.
Further images get a value that increases by 'Exposure Interval' with each image:
| |
 |
| |
Reading the measuring images |
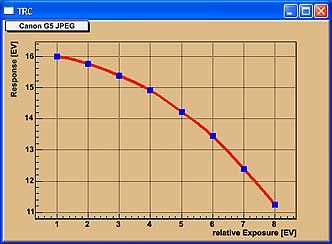
After the image reading is finished the 'TRC' window opens up showing the measured values as a graph.
The measuring points are joint by a curve.
It is now important to choose from all the images an exposure range where the camera provides precise measurements.
This includes:
-
Images that are not overexposed.
Overexposed images can be identified by the missing measurement in the histogram.
-
Images that show no or little noise.
Noisy images can be identified by their 'frayed' histogram. This means that the histogram shows widely spread lines instead of a distinct measurement.
In the example case the image with exposure value 0 is overexposed and hence excluded.
The images with exposure values 9.0 and 10.0 are excluded too because I find that they are too noisy.
Thus our example yields the following curve:
| |
 |
| |
Graph of the measuring points |
This brings TRC creation to an end principally.
In order to create the TRC file choose the menu item 'Images->Profile'.
A window appears showing the command line sequence for FDRProfiler.
The file name is deduced from the Parameter Set name but may be changed.
With 'Run' you then start FDRProfiler:
| |
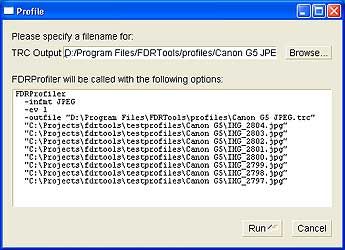 |
| |
Starting FDRProfiler |
Exit FDRGui and wait for FDRProfiler to finish.
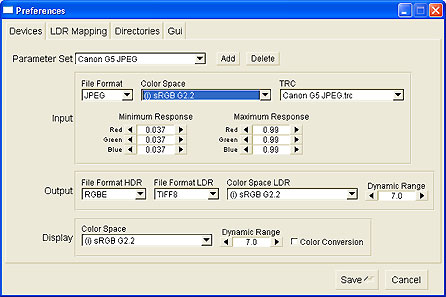
Now run FDRGui again to complete configuration.
Navigate to the 'Preferences' menu and within the 'Input' frame choose
-
the suitable color profile for the device.
In the example the 'sRGB' color profile is good.
If you have a custom made color profile for the device or the manufacturer has provided one, take it.
-
the TRC file just created.
In the example this is 'Canon G5 JPEG.trc'.
The values 'Minimum Response' and 'Maximum Response' were adjusted according to the selected exposure range:
| |
 |
| |
Completing the configuration |
Save the settings.
End.
Do you have questions or suggestions?
If so you may want to publish them on the Forum.
|